Cities Are Coming Back, but Urban Poverty Remains an Immense Challenge
It is hard to think of a phenomenon that has done greater damage to our environment (as well as to our economy and social fabric) than the mass exodus from our older cities and towns that took place in the latter half of the 20th century.
While we paved over farmland, forests, and watersheds, causing people to drive ever-longer distances to get things done, we tragically sucked population, investment and life out of older neighborhoods and communities as people with choices fled for the suburbs.
Our cities and the damage done
Sun Belt cities were spared much of the damage, but Eastern and Midwestern cities were especially hard-hit. While the periods of population loss have varied from one location to another, the numbers tell the story: Washington, DC, where I live, lost 29 percent of its population between 1950 and 2000; Chicago lost 26 percent between 1950 and 2010; Atlanta lost 21 percent between 1970 and 1990.
Even Seattle and Denver lost significant population during their periods of decline, and Cleveland has so far lost a staggering 57 percent of its population since 1950 and is still shrinking. While the losses have been particularly evident in large cities, our traditional small cities and towns have not been spared; the population of Corning, New York (2010 population 11,183), for example, declined by 39 percent between 1950 and 2000.
The reasons for urban decline are many, complex, and thoroughly documented elsewhere. But the result was to leave behind neighborhoods that were (and in many cases still are) impoverished and struggling.
To the extent that cities can be revived, there is a lot in it for the environment: compared to sprawl, cities and walkable towns do not desecrate and fragment the landscape; are far more efficient in their transportation patterns, reducing emissions and infrastructure costs; generate less per capita water pollution; use energy and material resources more efficiently; and promote public health through walkability.
There is a lot in it for urban residents, too, as tax bases can be replenished, urban services improved, and workers reconnected with the jobs they need. Neighborhoods that have fallen into disrepair can be restored and improved. There is a good deal of debate over who benefits most from these improvements, and I’ll get to that below, but there is little question about the environmental advantages of compact living.
The good news, of course, is that cities are indeed rebounding. Core cities are starting to grow again, and core counties are growing faster than their suburban counterparts in many places. Neighborhoods are being restored and even becoming “ecodistricts” in some cases. Demographers tell us that the worst of sprawl is over, that driving rates are trending down, and that the Millennial generation likes it that way.
Still a long way to go
But a recent report written by analysts Joe Cortright and Dillon Mahmoudi, and released by the up-and-coming urban think tank City Observatory, suggests that we still have a long, long way to go to overcome the damage caused by urban disinvestment and abandonment.
Cortright and Mahmoudi examined census tracts within ten miles of the central business districts of the nation’s 51 largest metropolitan areas, and compared the change in poverty rates in those neighborhoods from 1970 to 2010.
They classified the tracts as “high poverty” (more than 30 percent of residents living below the poverty line, as defined by the Census), “poor” (between 15 and 30 percent in poverty), and “low poverty” (less than 15 percent poor). (The national poverty rate has fluctuated between 11.5 and 15 percent over the decades studies, according to the authors.)
Their findings do not present a pretty picture:
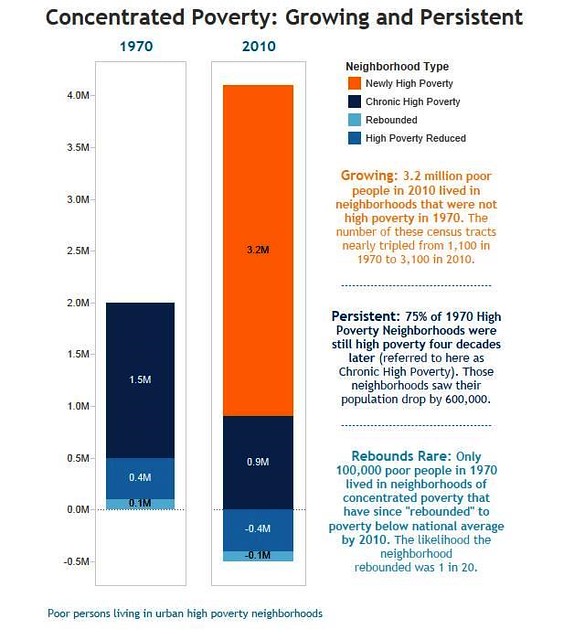
- From 1970 to 2010, the number of poor people living in high-poverty urban neighborhoods more than doubled from two million to four million, and the number of high-poverty neighborhoods nearly tripled from 1,100 to 3,100.
- The poor in the nation’s metropolitan areas are increasingly segregated into neighborhoods of concentrated poverty. In 1970, 28 percent of the urban poor lived in a neighborhood with a poverty rate of 30 percent or more; by 2010, 39 percent of the urban poor lived in such high-poverty neighborhoods.
- Of the 1,100 urban census tracts with high poverty in 1970, 750 still had poverty rates double that of the national average four decades later.
- Between 1970 and 2010, only about 100 of the 1,100 high-poverty urban neighborhoods experienced a reduction in poverty rates to below the national average.
- A majority of the increase in high-poverty neighborhoods can be accounted for by what the authors call “fallen stars”-- places that in 1970 had poverty rates below 15 percent, but that in 2010 had poverty rates in excess of 30 percent.
In other words, poverty remains concentrated and persistent in our nation’s largest metro areas, notwithstanding the welcome news about rebounding cities.
Cortright and Mahmoudi devote a chapter to the negative effects of concentrated poverty, contrasting the benefits of mixed-income neighborhoods, which significantly increase residents’ prospects for upward mobility (particularly on an intergenerational basis) by a range of economic measures. Moreover, high-poverty neighborhoods suffer continued population decline and deterioration of housing stock, according to the authors.
What the report says (and doesn’t say) about gentrification
Cortright and Mahmoudi clearly intend their report to put the thorny matter of gentrification into perspective, subtitling their report “Why the persistence and spread of concentrated poverty - not gentrification - is our biggest urban challenge.” And the data-rich report has the numbers to support that proposition, at least when one takes the long view over four decades: Far more neighborhoods fell into increased poverty over that time period than rebounded out of poverty. In particular, the analysis found that, over the four decades in question, 2,428 census tracts became newly poor, while 750 tracts remained poor. Only 105 rebounded out of poverty:
“The incidence of neighborhood rebounding--here defined as a previously high-poverty neighborhood that sees its poverty rate decline to less than 15 percent in 2010--is surprisingly small. Only about 100 urban census tracts saw this kind of change over a forty-year period in these 51 large metropolitan areas. The odds that a poor person living in a high-poverty census tract in 1970 would be in a place that 40 years later had rebounded are about 1 in 20.”
The authors also point to research showing that neighborhood change is constant and inevitable, with people moving out of even non-recovering neighborhoods on a regular basis, and they make the case that neighborhood decline receives less attention than neighborhood recovery because the decline takes place more gradually and less perceptibly over time.
I believe the analysis does contribute useful perspective on the concerns that people have about gentrification. Still, I can’t help but wonder what the analysis would have shown if it had looked at data over a more recent time period, for example from 1990 to 2010. I don’t have the research to back this up, but intuitively I believe that urban decline was far more precipitous between 1970 and 1990 than it has been since then.
An analysis of the last two decades might show more neighborhood recovery than the report shows, if recovery to something less than the generally lower poverty levels experienced in 1970. It might also show fewer neighborhoods sliding into poverty since 1990.
The gentrification that concerns people today may be a newer phenomenon that is somewhat masked by the longer time period used in the study. Governing magazine looked at more recent data and, according to an article written by Mike Maciag, found “in several cities” that “nearly 20 percent of neighborhoods with lower incomes and home values have experienced gentrification since 2000, compared to only 9 percent during the 1990s.”
That said, the Governing report agrees with the Cortright-Mahmoudi report that gentrification remains rare nationally, in its case finding that only eight percent of all neighborhoods reviewed experienced gentrification since the 2000 Census.
The methodology of the two reports differs significantly. Here’s how Governing defined the phenomenon:
“For this report, an initial test determined a tract was eligible to gentrify if its median household income and median home value were both in the bottom 40th percentile of all tracts within a metro area at the beginning of the decade. To assess gentrification, growth rates were computed for eligible tracts’ inflation-adjusted median home values and percentage of adults with bachelors’ degrees. Gentrified tracts recorded increases in the top third percentile for both measures when compared to all others in a metro area.”
The magazine found that, in eight metro areas - Portland, Washington, Minneapolis, Seattle, Atlanta, Virginia Beach, Denver, and Austin - fully 40 percent of eligible census tracts were gentrifying.
Maciag’s article is careful to point out that “gentrification remains a phenomenon largely confined to select regions,” and that some cities - the article specifically mentions Detroit, El Paso, and Las Vegas - have experienced practically no gentrification at all.
Cortright, incidentally, takes issue with the Governing analysis. I have a hunch that both reports are right: Concentrated poverty remains a very serious issue for our cities, one that has gotten significantly worse since 1970. And, yet, in some recovering cities declining neighborhood affordability is a significant problem for low-income residents.
In my opinion, we very much need urban recovery to continue. But we also need the benefits of that recovery to flow to all segments of our society. Finding answers to the significant problems that both of these reports identify is not going to be easy.
Move your cursor over the images for credit information.


