College Degree Density Revisited
You may recall a while back that a blog post by Rob Pitingolo ranking cities and counties by their density of college degrees (and vs. their expected density based on population) deservedly got quite a bit of attention.
I wanted to return to that topic and this time look not just at college degree density, but how density and other metrics related to college degrees have changed in the last decade. I thought it would be interesting to ask what counties in the US increased their college degree density the most in the last decade. Here's the answer:
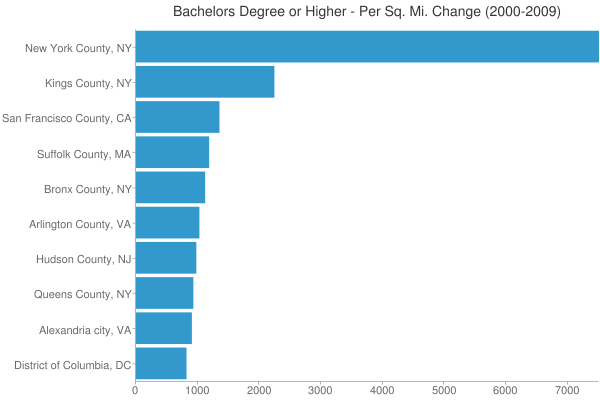
On the one hand this isn't surprising, since you think New York is big and dense already. But then you think that New York has actually been a slow growth city in the last decade. And then you look at the numbers. Frankly, it's staggering. Manhattan increased its density of people with college degrees by 7,500 people per square mile in the last decade. That's just the increase in density of just people with college degrees. That's more than the total population density of most cities in the United States.
We also read a lot about Brooklyn's (Kings County) transformation – and this metric shows it. But what jumped out at me was the Bronx – wow. Unsurprisingly, other talent hubs like San Francisco, Boston, and DC feature highly on the list. This helps illustrate what's been going on with these places. I should come as no surprise to see the incredible resurgence of New York, for example, given this type of educational attainment performance.
Now clearly there are caveats. These places benefit from generally high density to begin with, and are geographically small counties. There's no true apples to apples comparison here. If you are LA or Chicago, both of which occupy gigantic home counties, there's simply no way to compete on this metric. You'd need to pick a like for like geographic element, which would require some custom analysis. (I did not do city population in this analysis, because city boundaries change so frequently it would entail a lot of work). I suspect that on similarly sized areas, they'd show similar results. By the way, Alexandria, VA is shown on here since cities in Virginia are treated as independent cities, and thus show up as county equivalents in the data.
Let's take a look at these counties on some other dimensions of the educational attainment number. Here they are ranked by total increase in adults with college degrees.
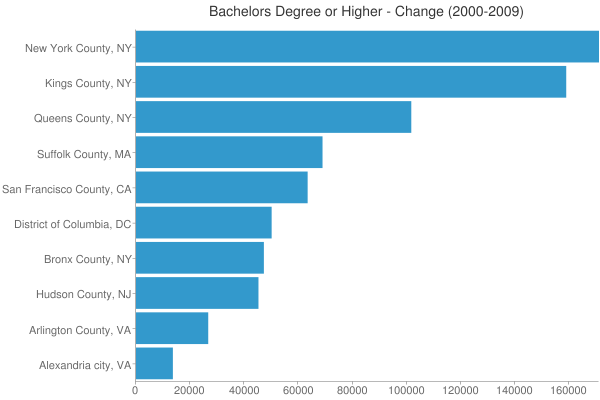
Again, pretty big numbers for the most part. To put it in perspective, the 171,000 college degrees added in Manhattan in the last nine years would constitute by my quick look the 141st largest city in the United States in its own right, roughly equal to the entire population of Chattanooga, TN.
I thought it would be interesting to see what percentage of total population growth was accounted for by people with college degrees in these places. Given that they are generally low population growth, I was expecting a high number, but even I was surprised to see that growth in people with college degrees was actually more than 100% in most of the cases. In other words, the population of people without college degrees shrank in these places.
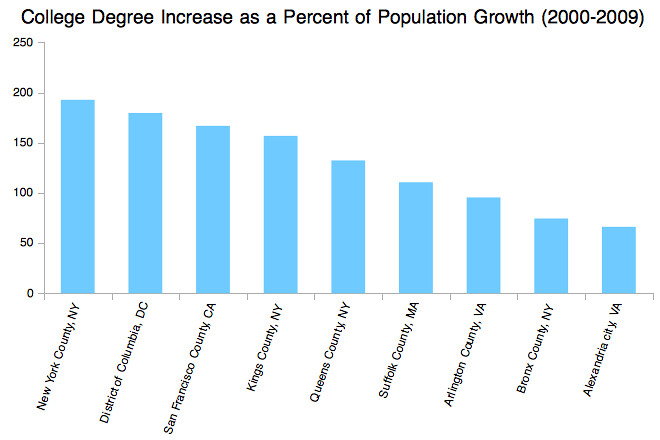
Hudson County, NJ actually lost population while adding about 45,000 people with college degrees. So I left it off the list.
This points out one of the negatives often highlighted about these cities, namely that they are getting more exclusive as increasingly you need to be in the educated elite to be able to live there (or at least to make it worth living there). This might be good for those cities at some level, but I'm not sure it's entirely good for America.
This was a quick hand crank analysis, so a particular caveat emptor on this one. (I used Census midyear estimates for the population).
Here's another experimental chart. I'm not sure how valid this is, but I applied a location quotient function to the numbers. LQ is normally used with employment data to measure the concentration of an industry in a region relative to the US concentration. If you have a number > 1.0, then you have a greater share than predicted by the US, and vice versa for < 1.0. Here I applied an LQ function for adults with college degrees, and looked at the change in that value over time:

As you can see, all of these places increased their concentration of college degrees relative to the US, with the exception of Alexandria. That city did grow degrees, but it was on such a high base to begin with that the percentage growth didn't match the US percentage growth. But many of the rest of these were on a high base to begin with too, and still managed to increase their relative concentration. Manhattan already had an LQ > 2.0 in 2000, for example.
This was some of the data I was looking at this week, which will hopefully provide some context around the changes that have been happening in America in the last decade, particularly with regards to talent hubs.
